To create charts, you drag items from the Insertable Objects pane to the following drop zones:
measures
columns, bars, lines, areas, or points to represent data series
groups, clusters, or stacks to represent categories of related data series
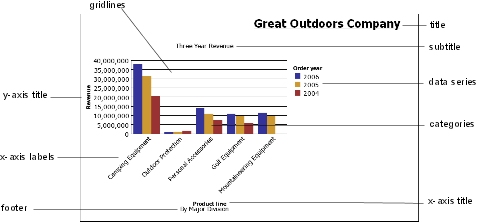
The following illustrates a typical chart as it appears in Cognos Viewer.
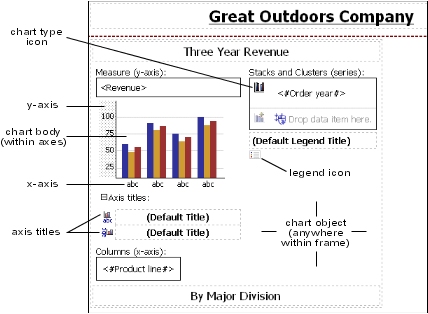
The following illustrates the same chart as it appears in the Report Studio interface. The y-axis is selected, and the axis titles are displayed.