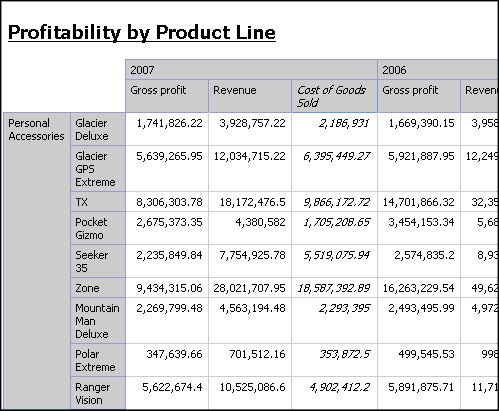
Use crosstab reports to show information in a more compact form than in a grouped list. For example, create a crosstab report to show total sales by product line generated by each sales representative.
Like list reports, crosstab reports are reports that show data in rows and columns. However, the values at the intersection points of rows and columns show summarized information rather than detailed information.

For information about how to create a crosstab report, see the Report Studio Quick Tour.
Tip: The Same Month Prior Year sample report  in
the Sales and Marketing (cube) package includes a crosstab. For
more information about The Great Outdoors Company samples, see Sample Reports and Packages.
Using crosstabs includes
