 in
the Insertable Objects pane shows a metadata-based
view of the data.
in
the Insertable Objects pane shows a metadata-based
view of the data.We recommend using dimensional data in the dimensional reporting style. However, if you are using relational data, see Add Relational Data to a Report.
If you are working with a dimensional data source, data items
are organized hierarchically. Dimensional data sources include OLAP
and dimensionally-modeled relational (DMR) data sources. The Source tab in
the Insertable Objects pane shows a metadata-based
view of the data.
Note: The names of levels and members in a dimension come from the model. It is the responsibility of the modeler to provide meaningful names.
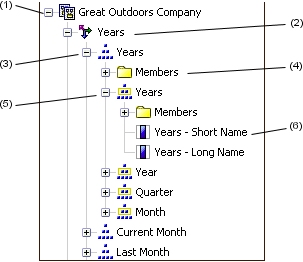
Package
Packages are subsets of a model containing items that you can insert in a report.
Dimension
Dimensions are broad groupings of descriptive data about a major aspect of a business, such as products, dates, or markets.
Level hierarchy
Level hierarchies are more specific groupings within a dimension. For example, for the Years dimension, data can be organized into smaller groups, such as Years, Current Month, and Last Month.
Members folder
Members folders contain the available members for a hierarchy or level. For example, the Members folder for the Years level hierarchy contains everything found in the Year, Quarter, and Month levels.
Note: To
see members folders, you must select the Show members
folder check box in the Tools menu  .
.
Level
Levels are positions within the dimensional hierarchy that contain information at the same order of detail and have attributes in common. Multiple levels can exist within a level hierarchy, beginning with a root level. For example, the Years level hierarchy has the following related levels.
Level | Level name | Description |
Root | Years | The root level. |
First | Year | Years in the Years root level. For example, 2004, 2003, and 2002. |
Second | Quarter | Quarters for each year in the Year level. For example, 2004 Q1, 2004 Q2, and 2004 Q3. |
Third | Month | Months for each quarter in the Quarter level. For example, Jan., Feb., and Mar. |
Tip: The Measures dimension contains the measures available in the data source.
Member property
Member properties are attributes that each member possesses. For example, gender could be a property for all employee members. For more information about member properties, see Insert a Member Property.
By default, when you insert members from the source tree into your report, single members are inserted without any details or children. You can change how members are inserted. For example, you may want to insert a member along with all its children or insert only the member's children.
When you double-click a member that you have already inserted in your report, by default, its children are inserted after the parent member. You can control whether the children are inserted before or after, nested, or not inserted at all: from the Tools menu, click Options, and then choose a setting on the Edit tab.
When inserting members into a crosstab, ensure that you insert members from the same hierarchy only on one of the crosstab edges. If you insert members from the same hierarchy on both edges of the crosstab, you may encounter unexpected results. For example, a report that uses members from years in the rows and Quarters in the columns is very difficult to read because the useful numbers are distributed over a large area of mostly blank cells.
Calculated members from the data source also appear in the source tree. However, calculated members in Microsoft SQL Server Analysis Services (SSAS) cubes do not appear in the list of descendants in the query. If you want these calculated members to appear in a report or a prompt, you must insert them explicitly.
Click the insert single member button  and
select how to insert members.
and
select how to insert members.
In the Insertable Objects pane, from
the Source tab , do one of
the following:
To insert a member above or below another member, drag the new member above or below a cell.
A flashing black bar appears where you can drop the new member.
To replace a member, drag the new member to the cell with the member to replace.
A flashing black box appears where you can drop the new member.
Use sets to group members that are logically related for various actions, such as formatting, nesting, and sorting. Creating sets is also useful when members may be dynamic over time. For example, the child accounts of a total assets account may change from year to year. By creating a set, you do not have to modify the report each time accounts are added or removed.
After you create a set of members, you can add or remove members within the set.
On the toolbar, click the create sets for members button  to
toggle between adding individual members and creating sets for members.
to
toggle between adding individual members and creating sets for members.
In the Insertable Objects pane, select the items to include in the set and drag them to the work area.
To add or remove members from the set, right-click the set and click Edit Members.
Tip: You can also select the set and, in the Properties pane, double-click the Members property.
You can quickly insert entire hierarchies in a report.
When using an IBM Cognos PowerCube, a SSAS cube, or a dimensionally-modeled relational data source, you can insert multiple hierarchies from the same dimension in a crosstab. For example, you can place one hierarchy from a dimension on an edge of the crosstab and nest another hierarchy from the same dimension on the same edge, on another edge, or in the Context filter area.
You can also perform arithmetic, percentage, and ranking calculations using multiple hierarchies.
Aggregate or analytic calculations that refer to different hierarchies from the same dimension, such as total, count, average, minimum, and maximum, are not supported. These calculations cause an OP-ERR-0250 error.
In the Insertable Objects pane, on
the Source tab , drag the
hierarchy to the report.
In the Insert Hierarchy dialog box, choose which members to insert:
To insert only the root members of the hierarchy, click Root members.
To insert all members of the hierarchy, click All members.
Tip: The default Level Indentation property for all members is to show the hierarchical structure when the report is run.
You can insert member properties in a report. For example, an employee level may have a property named gender.
In the Insertable Objects pane, on
the Source tab , drag the
member property to the report.
If the Insert Member Property dialog box appears, choose whether to repeat or group the property:
To repeat the property in the rows or columns of the crosstab, click Insert property only.
To insert the property and have it grouped, click Insert property and group it.
The property will appear once in the rows or columns of the crosstab.
This option is not available in the current version.
When you insert members in your report, you may want to nest them in another row or column to make your report easier to use. You can nest members from different dimensions. You can also nest sets.
For example, in the following report, the quarters (Q1 to Q4) were selected from the Time dimension and nested only for the GO Americas member, which is from a different dimension.
You can also double-click nested members to insert their
children or you can expand them .
When you filter out children from nested sets, the parent set still appears in your report. To avoid this, filter only the top level set and nest only the complete set of descendants at the desired levels.
In the Insertable Objects pane, on
the Source tab , drag the
members to the work area.
A flashing black bar indicates where you can drop an item.
You can perform a member search to quickly find data.
You can control the number of members that are returned
in a search by specifying a value for the Member display
count limit (in source tree) option .
In the Insertable Objects pane, on
the Source tab , select and
then right-click a dimension, hierarchy, or level and click Search.
In the Words box, type the words or characters for which to search.
Click the search parameter to use.
To search all descendants instead of just the immediate children, select the Search all descendants check box.
For example, when performing a search in a hierarchy, selecting this check box returns members found in all the levels of the hierarchy.
Click Search.
Report
Studio searches for all members for the object selected in step
1. The results appear in a hierarchical structure on the Search tab  in
the Insertable Objects pane. You can browse the
hierarchy to explore members at lower levels.
in
the Insertable Objects pane. You can browse the
hierarchy to explore members at lower levels.
Tip: You can insert members directly into a report. This can save you time, because you do not have to define a filter. For example, instead of inserting Product line from the Source tab and adding a filter for Camping Equipment, you can insert Camping Equipment from the Search tab.
Note: Extended data items do not apply to relational packages or non-dimensionally modeled packages.
Extended data items differ from the traditional, expression-based text strings by enabling you to do the following:
Add an extended data item's child members
You can double-click an extended data item to insert its child members beside it in the report object.
View an extended data item's details
You can select an extended data item and see where the data item appears in the package in the Properties pane under Data Item.
Select member sets
You can select a member in a set to highlight it as the primary selection and the other members as secondary selections.
Sort sets
You can select an extended data item, click the
sort button  , and click Advanced
Set Sorting to sort a set in ascending or descending
order, to sort hierarchically, and to sort by caption, by a property,
or by an intersection (tuple).
, and click Advanced
Set Sorting to sort a set in ascending or descending
order, to sort hierarchically, and to sort by caption, by a property,
or by an intersection (tuple).
Apply contextual calculations
You can select an extended data item and then, from the Data menu, click Calculate to see a contextual list of calculations that are available for this extended data item.
Extended data items are optional. If you use extended data items in a report, we recommend that you use them for the entire report instead of mixing them with expression-based data items. For information about turning on extended data items, see Specify Report Properties.
Note: In Express Authoring mode, extended data items are always used. Therefore, if you are authoring a report in Professional Authoring mode for report consumers who are working in Express Authoring mode, you should use extended data items.
In ragged or unbalanced hierarchies, some members that are not at the lowest level of the hierarchy may have no descendants at one or more lower levels. Support for these hierarchy gaps in relational data sources is limited. More complete support is provided for OLAP data sources, but some reports may still result in unexpected behavior. For example, the following may occur:
Groups corresponding to missing members may appear or disappear when grouped list reports are pivoted to a crosstab. This happens with set expressions using the filter function, and detail filters on members.
Ragged and unbalanced sections of the hierarchy are suppressed when set expressions in that hierarchy are used on an edge.
When a crosstab is sectioned or is split into a master detail report, sections corresponding to missing members become empty.
Cells that were suppressed may still appear in the report output for reports with ragged or unbalanced hierarchies.
Some of these behaviors may be corrected in a future release, while others may be codified as supported behavior. To avoid these behaviors, do not use levels from ragged or unbalanced hierarchies. Instead of using levels, use the descendants, children, or ancestors.
We consider the following scenarios to be safe:
One or more nested level references on an edge with no modifying expression.
A hierarchy reference on only one level of one edge.
One or more explicit members or sets of explicit members as siblings on only one level of one edge.
Summaries of the previous three scenarios.
In all cases, you should test reports based on ragged and unbalanced hierarchies to confirm that hierarchy gaps are handled correctly.
For more information about ragged or unbalanced hierarchies, see the Framework Manager User Guide.
When working with an OLAP data source, we recommend that you not use relational functions, such as substring and concatenation, in a report that also contains a measure with the Aggregate Function property set to Calculated or Automatic in the model. If you do so, you may encounter unexpected results. For example, some summaries are calculated using the Minimum function instead of the aggregate function derived from the individual query items.
In the expression editor, an exclamation mark (!) that precedes a function indicates that the function is not naturally supported for that data source. IBM Cognos 8 uses a local approximation for that function. Because an approximation is used, performance can be degraded and the results may not be what you expect.
For example, you create a Query Studio report that contains the data items Product line and Retailer site count. The footer summary is set to Calculated. You then insert a calculated column that returns the first three characters of the Product line item, which uses the relational function concatenation. The footer summary now shows the lowest gross margin value.
For more information about aggregation functions, see the Query Studio User Guide or the Report Studio Professional Authoring User Guide.
When using dimensional data, you can customize how you see data in the source tree. You can select a metadata view with dimensions, hierarchies, levels, an optional members folder, and member properties.
Or you can select a members-oriented tree view, such as the one in Analysis Studio. This view allows you to add only members in your report.
In the Insertable Objects pane, click
the Source tab .
Right-click anywhere in the pane and click Package Tree Settings.
Use the Preview pane to choose the appropriate settings.
