Drilling Up and Drilling Down in Dimensional Reports
When working with dimensional or dimensionally-modeled
relational (DMR) data sources, you can create reports that allow
the reader to view more general or more detailed information on
your data within a predefined dimensional hierarchy (such as Years
- Year - Quarter - Month) without having to create different reports.
You can link groups of data items from different queries so that
when you drill up or drill down in one query, the data item also
drills up or drills down in the linked queries. Linking data items is
useful if your report includes more than one query with the same
data item. For example, if your report shows a list and a crosstab
that each include the Product Line data item, you can link the Product
Line data item from the crosstab query to the Product Line data
item from the list query so that when you drill up in the crosstab
Product Line data item, the list Product Line data item also drills
up.
Member
Sets
Member sets are used to group data items that are logically
related for various actions, such as drill actions, zero suppression,
and ranking. They can be defined as a flat list or as a tree structure
in which member sets in the same parent chain are considered related.
For example, for drill operations, a member set defines the set
of items that can potentially change when a given item in the set
is drilled on. The values of other items in the query or even those
in the same hierarchy are preserved when any item in this set is
drilled on. Usually, a member set references items that have logical
roles in a drill action, such as a detail, a summary of the detail,
or a parent of the detail. A single data item can belong to only
one member set.
If you do not define member sets for items, the IBM Cognos 8
server associates items into default member sets and behaviors using
simple dimension rules on item expressions. You can override the
behavior for a particular item while other items continue to use
the default.
When you define a member set, you must explicitly define behaviors
for each item in the set. Items in the set that have no behaviors
have their values preserved.
Drill behaviors always act from a root member set. This means
that when an item is drilled on, the root member of its member set
is found and all items from the root down are processed. Although
calculations and aggregates are not directly related by hierarchy,
they respond because of their dependence on the items upon which
they are based.
Create Member Sets
Create a member set when you want to define a non-default
drill behavior. You specify what items respond to a drill action
by adding them to the member set.
Steps
Pause the pointer over the query explorer button  and click the query in which to create
a member set.
and click the query in which to create
a member set.
In the Properties pane, set the Define
Member Sets property to Yes.
Click the Member Sets tab.
In the Insertable Objects pane, drag
items to the work area.
To define a member set as a tree structure, drag the item that
will serve as the root item of the set to the work area, and then
drag other items over the root item to create the tree structure.
You can also nest member sets.
Create a Drill-up/Drill-down
Report
You can link groups of data items from different queries
so that when you drill up or drill down in one query, the data item
also drills up or drills down in the linked queries. Before you
begin, ensure that you are using a dimensional data source.
Tip: The Returned Items sample report  in the
GO Data Warehouse (analysis) package includes drilling. For more
information about The Great Outdoors Company samples, see Sample Reports and Packages.
in the
GO Data Warehouse (analysis) package includes drilling. For more
information about The Great Outdoors Company samples, see Sample Reports and Packages.
Steps
From the Data menu, click Drill
Behavior.
On the Basic tab, in the Report
output drill capabilities box, select the Allow drill-up
and drill-down check box.
By default, Report Studio determines which items can be drilled
on based on the dimensional structure.
Tip: To enable the report to be used as the source
during a package drill-through, select the Allow this
report to be a package-based drill-through source check
box and click OK. For more information about
package drill-through, see the Administration
and Security Guide.
To disable drill-up or drill-down for a data item, select
the data item in either the Disable drill-up for box
or the Disable drill-down for box.
From the Advanced tab, you can change
the drill-up or drill-down behavior for any data item by selecting
the data item and then choosing one of the following behaviors.
|
Preserve | The data item's value will remain unchanged. | The data item's value will remain unchanged. |
Empty Set | The set of values associated with this data
item is set to be the empty set (novalues). For crosstabs, the data item
will effectively be removed from the report. | The data item will be removed from the report. |
Replace Item | The data item's value will change to become
the parent (if a lowest-level summary was drilled up on) or the grandparent
(if a lowest-level detail of a dimension was drilled up on) of the item
that was drilled on. | The data item's value will change to become
the item that was drilled on. |
Replace Expression | The data item's value will change to become
the children of the parent (if a lowest-level summary was drilled
up on) or the children of the grandparent (if a lowest-level detail
of a dimension was drilled up on) of the item that was drilled on. | The data item's value will change to become
the children of the item that was drilled on. |
Change Expression | The data item's value will change to become
the value of some other data item in the query. | The data item's value will change to become
the value of some other data item in the query. |
Depth Based Expression | The data item's value will change to become
all data items "n generations higher" in the dimensional hierarchy than
the item that was drilled on. The number of generations or levels
is determined by the Depth value. | The data item's value will change to become
all data items "n generations higher" in the dimensional hierarchy
than the item that was drilled on. The number of generations or levels
is determined by the Depth value. |
Ancestor | The data item's value will change to become
the data value of the ancestor "n generations higher" in the dimensional
hierarchy than the item that was drilled on. The number of generations
or levels is determined by the Depth value. | The data item's value will change to become
the data value of the ancestor "n generations higher" in the dimensional
hierarchy than the item that was drilled on. The number of generations
or levels is determined by the Depth value. |
From the Data Items Linking tab, you
can link groups of data items:
Click the new button  .
.
Type a name for this group of linked data items and click OK.
To
rename a group of linked data items, click the group, click the
rename button  , type a name,
and click OK.
, type a name,
and click OK.
Use the arrows to move data items from the queries on the left
to the groups on the right.
Note: You can only add a
data item to one group.
The report will generate links for any item that can
be drilled up or down on.
When you run a report, you can drill down or drill up by right-clicking
the data item and choosing the action from the context menu. The
menu items will be disabled if an item cannot be drilled up or down
on.
Recommendation - Drilling Down
in Very Large Data Sources
When you drill down in a report that uses a very large
data sources query results can be much larger than what can be held
in memory. For example, if you insert the lowest level of four hierarchies
that each contain 1000 members, the report can contain 1000,000,000,000
cells. At best, this query will take a very long time to run. While
this large query executes, all other queries for the same server
process will likely be blocked. For most data sources, the query
will likely fail due to insufficient memory or timing out. Then
the memory is released and normal services resume.
However, when using a Microsoft SQL Server 2005 Analysis Services
(SSAS) cube, the memory consumed by the SSAS client is not always
released in a way that other queries can effectively re-use. The
server continues to run with insufficient memory, causing new queries
to either run very slowly or fail completely. You may encounter
an error, and, to continue, the system administrator must manually
stop and restart the IBM Cognos 8 service.
To avoid these problems, consider the size of hierarchy
levels and sets when creating reports and avoid combining them in
ways that create large queries. To determine the size of a set, create
and run a very small report that includes only a count of the members
within that set. You can also use filtering techniques to focus
your data .
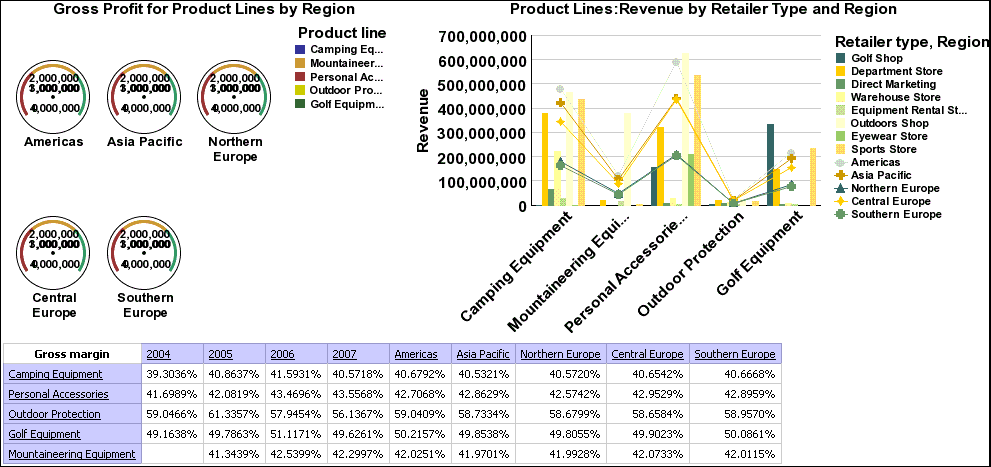
Example - Create a Dashboard Report
Create a dashboard report to show a high-level graphical
view of company performance indicators. By using dashboards, users
can
drill up and drill down to see higher
and lower levels of detail
navigate to other targets, including Report Studio reports,
Query Studio reports, and Analysis Studio analyses
include multiple charts derived from different data sources
in a single report
In this topic, you learn how to create a dashboard so that users
can examine important sales data in a single view.
It should take 15 to 20 minutes to complete this topic, and your
dashboard will look like this.
Steps to Create the Report and Add Data
Create a blank report with the GO Data Warehouse
(analysis) package.
Add a gauge chart, column chart, and crosstab.
Drag the following items to the gauge chart:
Gross profit (in Sales
fact) to the Default measure drop
zone
Product line level (in Product)
to the Needles (series) drop zone
Region level (in Retailer
site) to the Gauges drop zone
Drag the following items to the column chart:
Revenue (in Sales
fact) to the Default measure (y-axis) drop
zone
Product line level (in Product)
to the Category (x-axis) drop zone
Retailer type level (in Retailer)
and Region (in Retailer site)
to the Series drop zone
Drag the following items to the crosstab:
Gross margin (in Sales
fact) to the Measures drop zone
Product line level (in Product)
to the Rows drop zone
Year level (in Time dimension)
and Region level (in Retailer site)
to the Columns drop zone
Steps to Format the Gauge Chart
Click the gauge chart.
Set the Size & Overflow property
width to 400 px.
Set the Title property to Show.
Double-click the chart title and type the following text:
Gross Profit for Product Lines by Region
Set the Font property for the chart
title to Arial, 12pt, Bold.
Expand Axis titles, click the horizontal
axis title, and set the Visible property to No.
Click the numerical axis and, in the Maximum
Value property, type 4000000.
Steps to Format the Column Chart
Click the Region series and set the Chart
Type property to Line.
Note: The column chart becomes a combination chart
because you render the sales territory data as lines.
Click the chart, click the Palette property,
and select Contemporary from the Palette list.
Set the Size & Overflow property
width to 600 px.
Set the Title property to Show.
Double-click the chart title and type the following text:
Product Lines: Revenue by Retailer Type and Region
Set the Font property for the chart
title to Arial, 12pt, Bold.
Expand Axis titles, click the horizontal
axis title, and set the Visible property to No.
Steps to Specify the Drill Behavior
From the Data menu, click Drill
Behavior.
Select the Allow drill-up and drill-down check
box.
Run the dashboard to view what it will look like for your
users.
Users can drill up or drill down on values in the report to view
related information.
Need More Help?