The Report Studio user interface has two panes, an explorer bar, and a work area to help you create reports.
We recommend that you use a screen resolution of at least 1024 by 768 pixels.
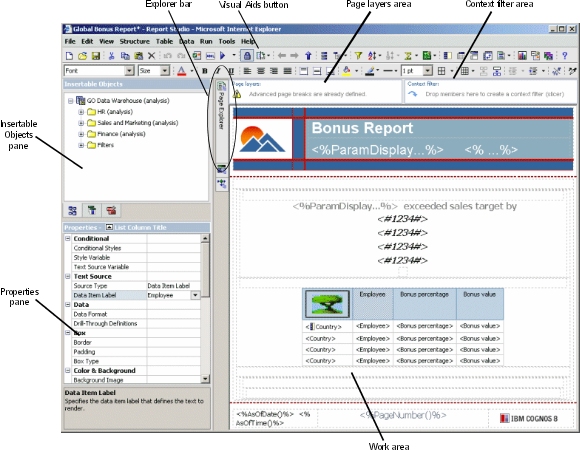
The Insertable Objects pane contains objects that you can add to a report. You add objects to a report by dragging them to the work area.
The Insertable Objects pane contains these tabs:
The Source tab contains items from the package selected for the report, such as data items and calculations.
The Data Items tab describes the queries created in the report.
The Toolbox tab contains a variety of objects that you can add to the report, such as text and graphics.
The Properties pane lists the properties that you can set for an object in a report.
You can obtain additional information about a property by selecting it and pressing F1. For example, you can view the list of objects that use each property.
When you specify a value for a property, press Enter, click another property, or save the report to ensure that the value is saved.
Tip: To view a description of the currently selected property at the bottom of the pane, from the View menu, click Property Descriptions.
Pause the pointer over the following buttons on the Explorer bar to work with different parts of a report:
the page explorer button 
You use Page Explorer to view or
create new report pages and prompt pages  or to create and modify classes .
the query explorer button 
You
use Query Explorer to create or modify queries in relational reporting or dimensional reporting and
to perform complex tasks, such as defining union joins and writing
SQL statements.
the condition explorer button 
You use Condition Explorer to work
with variables to define conditions in a report.
Use the Page layers area to create sections, or page breaks, in a report to show values for each member on a separate page. For example, you can drag Northern Europe sales territory from the Insertable Objects pane to the Page layers area. The report is broken into a separate page for each territory within northern Europe. Each page's context appears in the report header.
For more information, see Create Page Layers.
When working with dimensional data, use the Context filter area to filter your report to show values, or context, for only a specific data item. This technique is also known as a slicer filter. For example, you can drag Sales Territory from the Insertable Objects pane to the Context filter area. When you click a specific territory from the list, the values in the crosstab change to represent data for that territory.
For more information, see Create a Context Filter.
The visual aids button  provides
the following options to help you when you are designing reports
in the layout.
provides
the following options to help you when you are designing reports
in the layout.
Option | Description |
Show Boundary Lines | Shows all boundary lines. |
Force Boundary Lines | Overrides all boundary line settings by replacing them with default (dotted line) lines. For example, if you set the Border property for an object, the border lines are replaced with dotted lines. |
Show Repeating | Repeats objects when you insert them. For example, when you insert a data item in a crosstab, the data item appears in each row or in each column of the crosstab. |
Show Page Header And Footer | Shows the page header and page footer. |
Show Drag & Drop Padding | Shows drag-and-drop zone when the Padding property for an object is set to 0. If the Padding property is set to a value that is greater than the minimum padding that Report Studio uses to show drag-and-drop zones, only the minimum padding is shown. |
Show Hidden Objects | Shows objects for which the Box Type property was set to None or for which the Visible property was set to No. |
Show Sorting | Shows the sorting icon for data items for which a sort order was specified. For more information about sorting data, see Sorting Relational Data or Sorting Dimensional Data. |
Show Grouping | Shows the grouping icon for grouped data
items |
Show Source Type | Shows the icon for the source type of objects, such as layout calculation. |
Show Data Item Type | Shows the icon for the type of data item, such as query item, member, or measure. |
Show Drill-through Definitions | Shows data items for which the drill-through
definition |
Show Table of Contents Entries | Shows table of contents entries |
Show Bookmarks | Shows bookmarks |
Show Master Detail Relationships | Shows master detail relationships Tip: Pausing the pointer over the master detail relationship icon shows the relationship. |
Show No Data Contents Tab Control | Shows tabs if the data container's No
Data Contents property is set to Yes |
Show Repeater and Singleton Containers | Shows repeater and singleton containers inserted in the report. |
