Using Dimensional Calculations
Create calculations to make a report more meaningful
by deriving additional information from the data source. For example,
you create an invoice report and you want to see the total sale amount
for each product ordered. Create a calculated column that multiplies
the product price by the quantity ordered.
In Report Studio, you can create the following types
of calculations:
When working with dimensional data sources,
create a simple member calculation with the insert calculation button  .
.
When working with dimensional data sources, create Calculated
Members or Calculated Measures where
the expression is a member or a tuple-based (as opposed to property-based)
value expression .
When working with dimensional data sources, use set expressions
to create calculated sets of members .
You must base each set expression on a
hierarchy and the set expression must contain only members from
this hierarchy.
When working with dimensional data sources, use a Layout
Calculation in all other cases .
Note: Query calculations are
also available in Report Studio, but they are more useful for relational
reporting. For information about using query calculations in relational
reporting, see Using Relational Calculations.
You can add calculations to lists, crosstabs, and all other data
containers. You can also add calculations directly to a page header,
body, or footer. However, you must first associate a query to the
page. For more information, see Add a Page to a Report.
Limitation When Using Dimensional Functions with
Running and Moving Summaries
IBM Cognos 8 does
not currently support queries that contain both dimensional functions
and running summaries or moving summaries. For example, when you
drill down in a report, the query uses the dimensional function children,
which is not compatible with running and moving summaries. Running
and moving summaries are supported for only the overall level of
a dimension.
Units of
Measures
When creating calculations in Report Studio and Query Studio,
you may encounter problems with the units of measure. For example,
the calculation Cost*Cost returns the unit of measure * instead
of a currency unit of measure. To avoid this problem, change the
format of the corresponding column to obtain the desired unit of
measure.
Create a Simple
Member Calculation
When working with dimensional data sources, you can
select members in your report and create simple calculations. In
addition to simple arithmetic calculations, you can perform the following
calculations:
|
Rollup | Summarizes, or rolls up, all the values
in a hierarchy. |
% | Calculates the value of a selected item
as a percentage of another item. |
% Growth | Calculates the difference between two items
as a percentage. |
% Of Base | This calculation is only available if you
select two members from different hierarchies, each from a different
edge. This calculation takes the first selected member from
edge A and the second selected member from edge B. The calculation result
of a percent of base should be such that all the values for member
A will compare itself to the intersect value of member A and B. |
Custom | Allows you to specify your own value when
performing a simple arithmetic calculation. Also allows you to change
the order of operands or type a custom name for the new calculated
row or column. |
To perform a more complex calculation, using expressions and
functions, insert a query or layout calculation ,
calculated member or measure , or a set expression .
Steps
Select the items in your report to calculate.
Click the insert calculation button  and
select the calculation to perform.
and
select the calculation to perform.
Tip: Calculations that are not applicable to the items
you selected are greyed out.
To change the order of the operands or the name of the
calculated item added to the report, click Custom.
Create a Layout Calculation
Create a layout calculation to add run-time information
to your report, such as current date, current time, and user name.
When creating layout calculations, only report functions
are available to you in the expression editor. These functions are
executed in the report layout, as opposed to the other functions which
are executed in the query. For more information, see Functions Not Available When Creating a Report or Layout Expression.
Steps
In the Insertable Objects pane, click
the Toolbox tab  .
.
Drag Layout Calculation to the report.
In the Available Components box, define
the calculation:
To add data items that are not shown
in the report, on the Source tab  ,
double-click data items.
,
double-click data items.
To add data items that are in the report but not necessarily
in the model, such as calculations, on the Data Items tab  ,
double-click data items.
,
double-click data items.
To add data items from a specific query ,
on the Queries tab  ,
double-click data items.
,
double-click data items.
To add functions, summaries, and operators, on the Functions tab  ,
double-click elements.
,
double-click elements.
To add a value that is derived from a parameter, on the Parameters tab  , double-click
a parameter.
, double-click
a parameter.
Parameters define prompts , drill-through
reports , and master detail relationships .
Tip: You
can also type the expression directly in the Expression
Definition box.
For more information about creating
expressions, see Using the Expression Editor.
Click the validate expression button  .
.
Insert a Calculated Member or Measure
When working with
dimensional data, insert a calculated member or measure into your
report to add a new row or column with values that are based on
a calculation. For example, you create a calculated measure named
Euros that converts dollars to euros by multiplying an existing dollar
measure by a conversion rate. Euros can then be displayed to end
users in a separate row or column.
Insert a calculated measure when the focus of the calculation
is one or more measures and when you want the calculation to behave
like a measure or to replace a measure. The expression used to define
the calculation must not depend on the current measure context.
Insert a calculated member when you want the calculation to behave
like a member or to replace a member. In this case, you must choose
a hierarchy. The value expression must not depend on the current
member context.
You use the expression editor to define the calculation. You
can also create a calculation that uses an intersection (tuple)
that you already defined .
Assigning a Hierarchy or Dimension
You must assign
each calculated member or measure to a hierarchy or dimension. We
recommend that you select the hierarchy or dimension upon which
your calculation focuses. For example, if your calculated member
is based on years, select the Time hierarchy. If you create a calculated
measure, select the Measures dimension.
Select only a hierarchy that cannot affect the value of the calculation.
For example, the hierarchy Camping Equipment has the same value
no matter what Products context it appears in the report. Therefore,
the calculation ([Camping Equipment]-[Mountaneering
Equipment]) has a well-defined meaning only in the Products hierarchy,
so select that hierarchy.
the calculation tuple([Revenue], [Camping Equipment]) can be
assigned to either the Products or Measures hierarchy, as it is
not affected by either context.
the calculation ([Revenue] - [Camping Equipment]) does not have
a well-defined meaning in any hierarchy, and therefore cannot be
used reliably at all.
Automatic Database Aggregation
You can use automatic database aggregation only when using IBM
Cognos PowerCubes and Microsoft SQL Server 2005 Analysis Services
(SSAS) data sources.
Steps
In the Insertable Objects pane, click
the Toolbox tab .
Drag Calculated Member or Calculated
Measure to the report.
In the Name box, type a name for the
calculation.
In the Hierarchy or Dimension box,
select the hierarchy that contains the measure or member that is
the focus of this calculated member or measure.
In the Available Components box, define
the calculation:
To add data items that are not shown
in the report, on the Source tab ,
double-click the data items.
To add data items that are in the report but not necessarily
in the model, such as calculations, on the Data Items tab ,
double-click the data items.
To add data items from a specific query
in the report , on the Queries tab , double-click
data items.
To add functions, summaries, and operators, on the Functions tab ,
double-click elements.
To add a value that is derived from
a parameter, on the Parameters tab , double-click
the parameter.
Parameters define prompts , drill-through
reports , and master detail relationships .
Tip: You can also type the calculation directly in
the Expression Definition box. When typing
date values, use the YYYY-MM-DD format.
For more information about creating expressions,
see Using the Expression Editor.
Click the validate expression button .
Create a Set Expression
When
working with dimensional data, set expressions are a set of dimension
members that you create to reuse in queries in your reports. For
example, you can create a named set called Top Ten Products that
contains the ten members of the Product Name dimension that have
the highest values for the Gross Profit measure. You can then use
the Top Ten Products set in queries.
When you insert a Set Expression object,
you must select a hierarchy and a set expression. The expression
must return members from the specified hierarchy. Note that the Tuple function
returns an intersection value and not a member, and is therefore
not a set expression.
Steps
In the Insertable Objects pane, click
the Toolbox tab .
Drag Set Expression to the report.
In the Name box, type a name for the
calculation.
In the Hierarchy box, select the hierarchy
within which you will create this calculated member or measure and
click OK.
The Data Item Expression dialog box appears.
In the Available Components box, define
the calculation:
To add data items that are not shown
in the report, on the Source tab ,
double-click the data items.
To add data items that are in the report but not necessarily
in the model, such as calculations, on the Data Items tab ,
double-click the data items.
To add data items from a specific query
in the report , on the Queries tab , double-click
data items.
To add functions, summaries, and operators, on the Functions tab ,
double-click elements.
To add a value that is derived from
a parameter, on the Parameters tab , double-click
the parameter.
Parameters define prompts , drill-through
reports , and master detail relationships .
Tip: You can also type the calculation directly in
the Expression Definition box. When typing
date values, use the YYYY-MM-DD format.
For more information about creating expressions,
see Using the Expression Editor.
Click the validate expression button .
Create an Intersection (Tuple)
When working with dimensional data,
an intersection, also known as a tuple, is useful for obtaining
a value from the combination of two or more members that you specify.
Each member must be from a different hierarchy. The intersection
can include only one measure.
For example, the intersection (Revenue, 2004, Cooking Gear) shows
the revenue value for the year 2004 and for the product line Cooking
Gear.
Use tuples to avoid report summaries
that do not reflect the visible data. For more information about
this issue, see Summaries in Report Do not Correspond to the Visible Members.
Steps
In the Insertable Objects pane, click
the Toolbox tab .
Drag the Intersection (Tuple) object
to the report.
From the Available members and measures pane,
select items and click the right arrow to move them to the Intersection
members and measures box. You can also use items from
the Calculated Members and Measures tab  .
.
To define the hierarchy for this intersection, click a
parent object in the Intersection hierarchy box.
Intersecting Calculations in Crosstabs
and Charts
An intersection point in a crosstab or chart can contain
a value that is derived from multiple calculations.
If the query expressions for the row and column that intersect
in a crosstab both include calculations, the intersecting value
is the result of performing both calculations. The second calculation
is performed on the result of the first calculation. If you change
the order in which the calculations are performed, the resulting
value at the intersection point changes.
The solve order is a positive numeric value that you assign to
data items. Negative values are not supported. The data item with
the lowest value is calculated first, followed by the next higher value,
and so on. The data item with the highest solve order is computed
last. If you do not specify a solve order, the default value of
0 is used. In crosstabs, if more than one data item has the same
solve order, column items are calculated first and row items are
calculated second.
For example, a crosstab contains the columns Actual revenue,
Sales target, and a column that calculates the percentage by which
actual revenue exceeds target revenue. The crosstab contains a row
for each Sales year and a summary row that calculates the overall
totals for each of the three columns. The cell where the percentage
calculation and the overall total calculation intersect contains
only one value. By default, IBM Cognos 8 calculates the
column percentage first and the summary row last. The value that
appears at the intersection is therefore a sum of the percentages,
which is not a meaningful result. The value is more meaningful if
the overall percentage is calculated after the actual and sales
target revenues are summed. Specifying a solve order for the percentage
calculation that is higher than the overall total calculation gives the
following result:
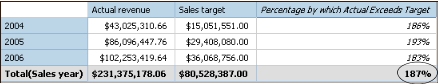
It is not necessary to specify the solve order for the overall
total calculation. Because the default solve order is 0, setting
the solve order for the percentage calculation to a value higher
than 0 is sufficient.
Nested Calculations in Crosstabs
If a crosstab contains nested calculations, the calculations
are performed in the following order by default:
outermost calculation on the columns
innermost calculation on the columns
outermost calculation on the rows
innermost calculation on the rows
If there are solve order ties, column items are calculated before
row items and outer nesting items are calculated before inner nesting
items.
Resolve Multiple Calculations for Crosstabs and Charts
If an intersection in a crosstab or chart contains a
value that is derived from multiple calculations ,
you can specify the order in which to perform the calculations.
The solve order must be a positive numeric value. The calculations
are performed from lowest to highest solve order value.
Setting the Rollup Aggregate Function property
to Calculated for a data item assigns
a solve order that is higher than any other data item in a query
unless a solve order is explicitly specified. If there are multiple
data items that have the Rollup Aggregate Function property
set to Calculated, the normal rules for solve
order apply.
Steps
Click the data item for which to specify the solve order.
A data item can have only one solve order value. Consequently,
if a data item is in a query that is used in more than one context
and you want the data item to have a different solve order in each
context, you must use a separate data item.
Tip: In crosstabs, to specify the solve order for the
default measure , click the crosstab and, in the Properties pane,
click the select ancestor button  and click Crosstab.
In the Properties pane, set the Solve
Order property to an integer value.
Tip: To specify the solve order for the default measure,
click Default Measure Solve Order.
Resolve
Query Calculations that Intersect with Calculated Measures Defined
in Microsoft Analysis Services
Microsoft SQL Server Analysis Services (SSAS) data sources
may include data source calculations. Because IBM Cognos 8
cannot predict the presence of a solve order on such calculations,
setting the Solve Order property may not resolve
the solve order correctly. You can suppress potentially meaningless
results when querying dimensional data sources that include data
source calculations. In the following example, the columns YTD
Change and YTD Growth are data source
calculated members and the summary values for these two columns
were suppressed.
When a query-defined calculated member and a data source calculated
member intersect, the value is the result of performing both calculations.
The second calculation is performed on the result of the first calculation.
Whether the final value is meaningful depends on the order in which
the calculations are performed. Because IBM Cognos 8 cannot
determine the presence of these members ahead of time, it cannot
automatically determine the correct solve order.
This issue occurs mostly with Aggregate summaries
in SSAS 2000. In most cases, SSAS 2005 gives the
expected results when no solve order is defined in the cube. Therefore, when
using SSAS 2005, you do not need to set either the Solve
Order property in the query or the Calculation
Intersection property. If your SSAS 2000 cubes
include calculated members, we recommend that you migrate to SSAS 2005.
Note: Dimensionally-modeled relational (DMR) data sources
query one or more underlying relational databases, and therefore
cannot contain data source calculations. They are not considered
dimensional data sources in the context of this topic.
Steps to Suppress Values for Specific Data Items
Pause the pointer over the query explorer button  and
click the query that contains the data item for which to suppress
values.
and
click the query that contains the data item for which to suppress
values.
In the Data Items pane, click the
data item.
In the Properties pane, set the Calculation
Intersection property to Show "Not applicable".
When a query-defined calculated member and a data source
calculated member intersect, the resulting value is suppressed.
If the intersecting members do not contain data source calculations,
the value is not suppressed.
